Sembix Strata™ · Launch · Plan
Delivery forecasts: finish dates sponsors can plan around, and where work waits

Jack Histon, Co-Founder & CTO
When a sponsor asks when the work will be done, the answer has been a single date that could swing wildly after a few busy weeks or one departure. When they ask why it took longer than planned, the honest answer has often been a shrug, because the figures didn't add up to anything you could quote.
Sponsors see when the work will likely land, and how sure the forecast is
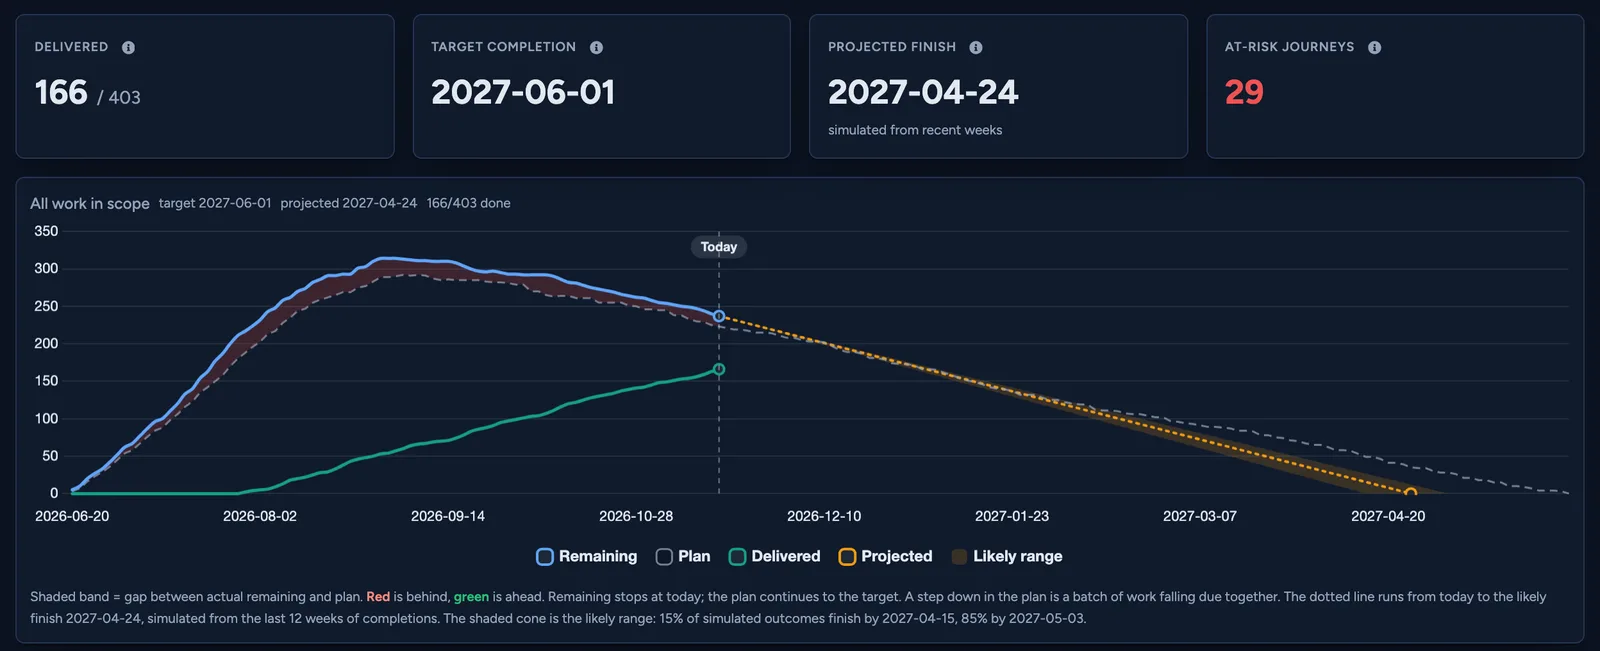
The roadmap's progress chart now gives a likely finish date and a date the work is 85% likely to finish by, so sponsors can plan around a range instead of a date that keeps moving. A sponsor, who holds Strata's customer role so they can read the roadmap but not change it, opens the Roadmap tab before a steering meeting. The chart shows how much committed work is left over time and where it is likely to finish. A shaded band runs from the date the earliest likely outcomes finish by to the date 85% of them do, so the sponsor walks in knowing both the date and how firm it is.
The forecast is built from the team's recent delivery and leaves out anyone who hasn't delivered in the last four weeks, so a colleague who has moved on no longer props up the date. The old projection worked from a recent average, so a few strong weeks or a departure could swing the date wildly. A date that moves every week is less a forecast than a weather report.
The forecast is built from past delivery, so it cannot see a change in pace that hasn't happened yet. Sponsors with the customer role cannot change dates. They ask the project manager, who sees the same forecast in their own planning view.
Sponsors see which stage held the work up, and where the team's hours went
The Cycle time report now shows how long work waits at each stage and how much of it Strata's AI agent did, so a manager can tell a sponsor exactly where the time went. A project manager opens the Cycle time tab before a sponsor review to explain why some issues, the pieces of work the team tracks, took longer than planned. A list shows the average wait in each status column, meaning each stage work moves through on the team's board. That turns a vague sense that things are slow into one stage to look at. Next to it, the tab counts the days each issue and each person assigned to it spent actively working, so the manager can see whether an issue was slow because it waited or because the work itself was long.
The "Who did the work" card splits each piece of work between what Strata's agent did and what took a person's hands-on time, so a manager can show a sponsor where the team's hours went. Figures are now averaged per issue rather than piled up across work that ran in parallel, so a manager can quote them to a sponsor without a caveat.
The report shows where work waits, but it does not move it. Deciding what to change at that stage is still up to a person. The report is for managers and sponsors, so developers do not see the tab.
Getting started
Available from Strata 3.181.0. If you're not sure which version you're on, your Strata administrator can tell you.
Both changes appear in views your teams already use, with nothing to turn on. Sponsors with the customer role read the forecast on the roadmap, and project managers and admins see the same forecast in their own planning view. The Cycle time tab is open to project managers, customers and project admins. Decide first who will bring the forecast and the cycle time figures to sponsor reviews, and point them to the guides below.